
Precious metal values in Dubai have experienced a notable decline, driven primarily by falling crude oil markets and persistent macroeconomic inflation anxieties that are reshaping global investor sentiment.
Gold Prices in Dubai Soften Amid Oil Slump and Inflation Pressures.
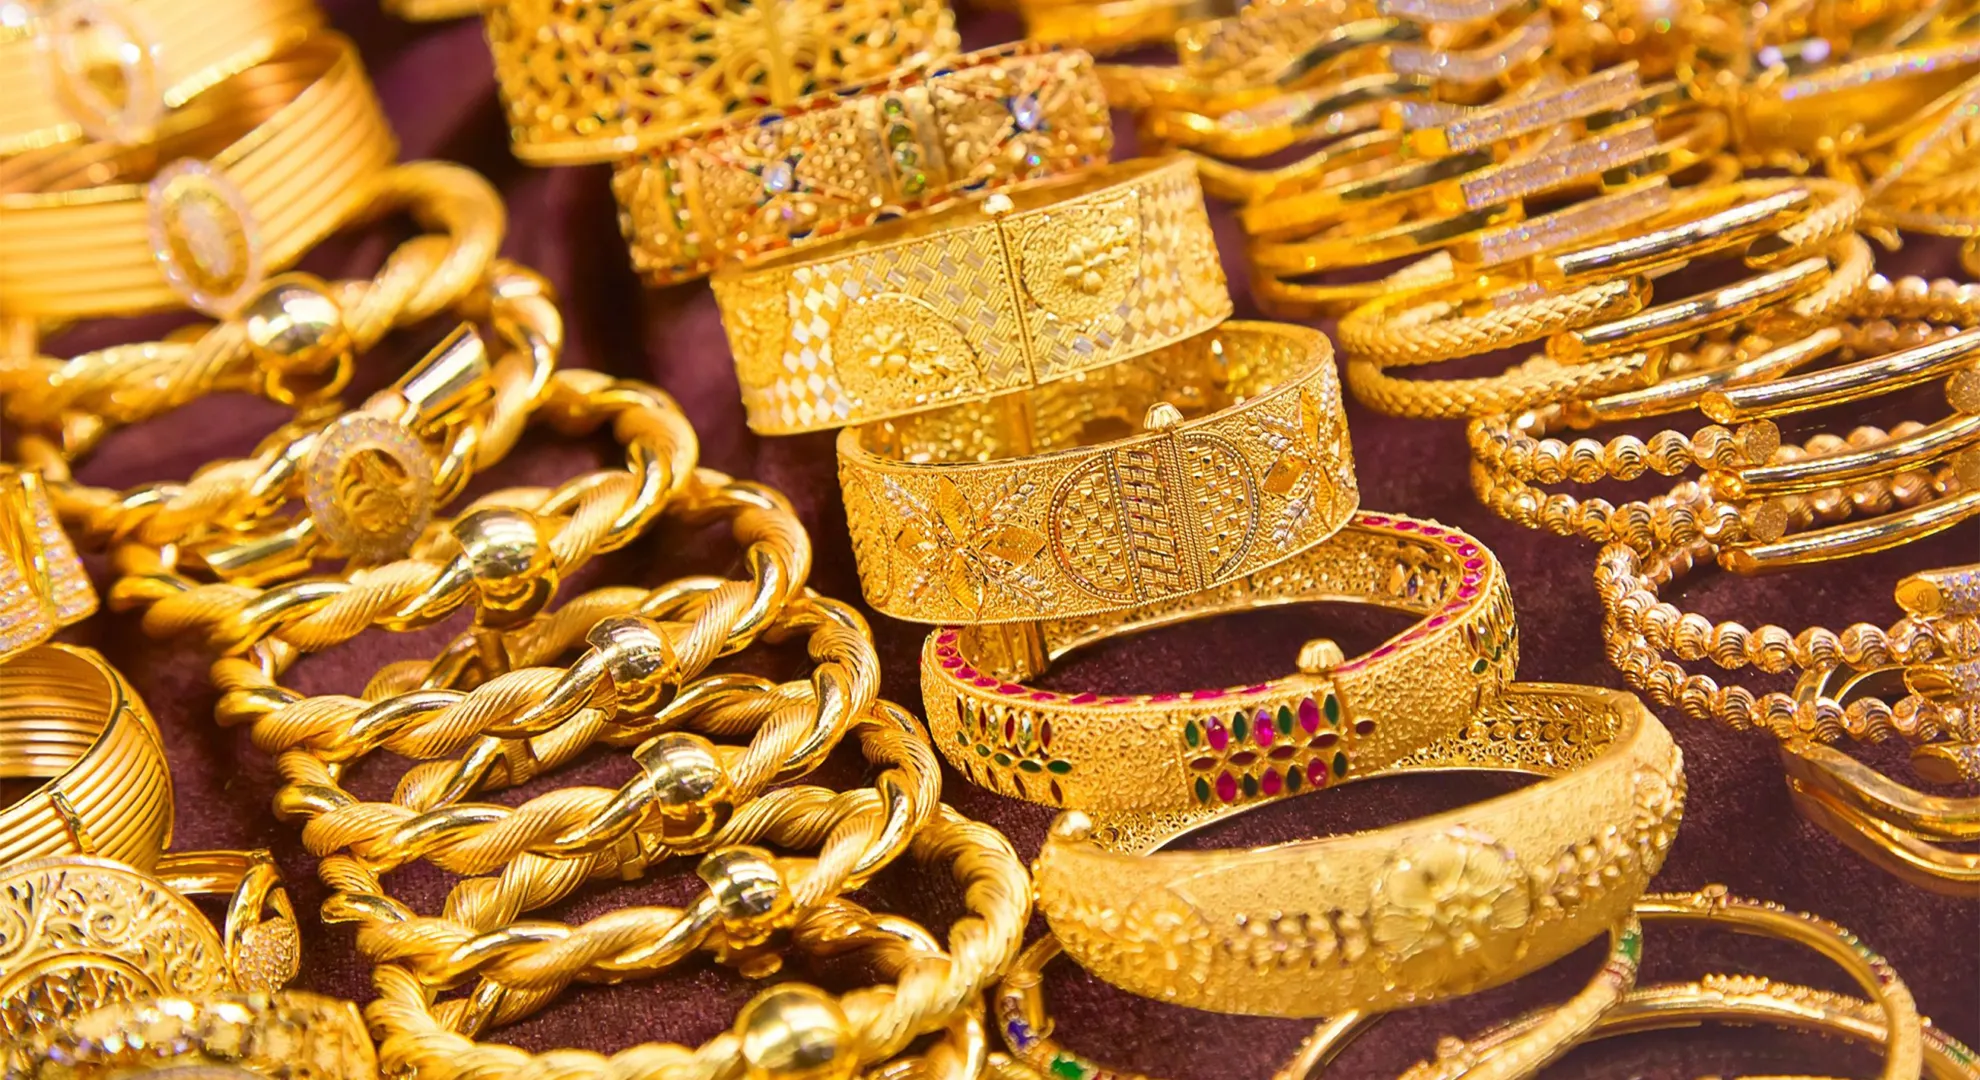
The precious metals market opened the week on a downward trend, pressured by ongoing macroeconomic inflation anxieties and a renewed surge in global crude oil purchasing activity.
Dubai Gold Markets Slip Midweek: Analyzing Global Inflation, Oil Dynamics, and Geopolitical Pressures
The precious metals market in Dubai experienced a downward adjustment on Wednesday, extending a subdued start to the trading week. This recent softening in gold values comes against a complex macroeconomic and geopolitical backdrop marked by persistent inflation worries, shifting energy markets, and heightened diplomatic tensions across the international stage.
Midweek Price Movements Across Dubai’s Retail Sectors
At the opening bell on Wednesday morning, Dubai’s gold markets reflected noticeable moderation compared to the previous day’s closing figures.
- 24-Karat Gold: The purest variant opened trading at Dh523.50 per gram, declining from the previous session’s close of Dh526.00 per gram.
- Other Fineness Variants: According to benchmark statistics provided by the Dubai Jewellery Group, alternative purities adjusted downward correspondingly:
- 22-Karat Gold: Rettailed at Dh484.75 per gram.
- 21-Karat Gold: Settled at Dh464.75 per gram.
- 18-Karat Gold: Traded at Dh398.50 per gram.
- 14-Karat Gold: Stood at Dh310.75 per gram.
Despite the retail easing observed locally, global spot commodities exhibited mixed directional movements. Spot gold edged upward by 0.11 per cent, hovering at $4,334 per ounce. Concurrently, silver outperformed gold slightly on the session, registering a 0.95 per cent gain to trade at $66.66 per ounce.
Macroeconomic Pressures: Inflation and the Energy Market Rebound
Analyzing the broader forces acting upon the commodities sector, Vijay Valecha, Chief Investment Officer at Century Financial, pointed out that precious metals entered the week on a fragile footing.
“Metals are under pressure today as renewed inflation concerns and a rise in oil buying interest, after five sessions of declines, weigh on the market,” Valecha explained.
The sudden resurgence in crude oil purchasing activity—following a nearly week-long downward trajectory—has injected fresh cost-push inflation anxieties into global financial markets. Because gold and other precious assets are traditionally viewed as hedges against rising consumer prices, shifts in energy costs directly influence investor sentiment and valuation models across bullion exchanges.
Geopolitical Flashpoints: Middle East Tensions and UN Diplomacy
Beyond domestic retail adjustments and energy market fluctuations, international geopolitics continue to play a pivotal role in dictating gold’s trajectory. Tensions in the Middle East escalated sharply following statements delivered at the United Nations General Assembly. US President Donald Trump used his UN address to issue severe warnings, threatening decisive action regarding Iran.
This aggressive rhetoric initially threatened to destabilize regional stability, an eventuality that typically triggers a classic “safe-haven” stampede into bullion assets. However, market anxiety was partially tempered by simultaneous diplomatic developments. Reports surfaced detailing high-level meetings involving the Iranian delegation in New York, sparking cautious optimism among investors that diplomatic channels might yet prevail to defuse regional flashpoints.
Monetary Policy and Upcoming Bilateral Summits
Adding to the crosscurrents impacting bullion, monetary policy expectations are exerting a distinct ceiling on potential price rallies. Valecha noted that prevailing expectations of a hawkish Federal Reserve stance are actively capping gold gains throughout the week. This monetary restraint is further reinforced by the performance of the greenback, with the US dollar stabilizing near a formidable two-month high against major international currencies.
Furthermore, institutional investors and retail traders alike are adopting a wait-and-see posture ahead of high-stakes macroeconomic milestones.
“Investors are also cautious ahead of the upcoming Trump-Xi meeting on Thursday, awaiting updates before making major moves in gold,” Valecha noted, emphasizing the market’s reluctance to commit significant capital ahead of bilateral trade and geopolitical clarity.
Looking ahead, market analysts anticipate that gold will likely remain confined within its established technical trading range. A decisive breakout from this consolidation pattern is largely contingent upon external catalysts—most notably, any sharp escalation in the Middle East conflict capable of triggering a secondary surge in global crude oil prices.

Technical Analysis of Precious Metals: Examining Momentum Loss, RSI Indicators, and Key Support Levels for Gold and Silver
As the precious metals market navigates a complex matrix of macroeconomic pressures, energy market shifts, and international geopolitics, technical chart analysis offers crucial insights into upcoming price trajectories. Evaluating the mathematical momentum and historical price action of bullion provides traders with a clearer picture of where market floors and resistance ceilings are likely to form.
Decoding Gold’s Technical Momentum: RSI Indicators and Consolidation
According to Vijay Valecha, Chief Investment Officer at Century Financial, a closer inspection of gold’s daily technical charts reveals clear signals of fatigue. The precious metal is actively exhibiting signs of waning upward momentum.
A primary indicator of this cooling trend is the Relative Strength Index (RSI)—a widely utilized momentum oscillator that measures the speed and magnitude of recent price changes to evaluate overbought or oversold conditions. Valecha pointed out that gold’s daily RSI has recently slipped below the neutral 50 level. In technical analysis terms, a drop below this midpoint often signals a shift in short-term momentum from bullish to neutral or mildly bearish territory.
This technical softness aligns closely with broader price behavior observed throughout the month. Gold has largely remained range-bound, oscillating within a defined horizontal channel without establishing a decisive breakout in either direction.
For traders monitoring risk parameters, identifying immediate structural support is paramount:
- Near-Term Support Level: Valecha highlights that potential downside support for gold rests near the $4,261 price threshold.
- Trendline Dynamics: This specific support level is reinforced by a prominent upward-sloping trendline that connects the historical lows established across previous market troughs, suggesting that buyers may step in should prices test this technical floor.
Parallel Technical Structures in the Silver Market
Mirroring the technical behavior observed in gold, the white metal is displaying a remarkably similar structural pattern on its charts. Silver’s price action reflects comparable consolidation tendencies, as investors weigh industrial demand against broader macroeconomic uncertainties.
Analyzing silver’s support architecture, Valecha notes:
- Support Threshold: Potential technical support for silver is currently identified around the $63.36 mark.
- Historical Reference Points: This crucial support floor is derived from significant price troughs recorded previously in mid-August and September, serving as a historical baseline where buying interest has traditionally emerged to absorb selling pressure.
As market participants await key political summits, monetary policy announcements, and potential geopolitical catalysts, these technical indicators will serve as vital signposts for determining whether precious metals will maintain their current consolidation channels or break toward new trading ranges.